5. Getting the results
5.1. View plots and results on screen
You can perform different assessments with different models and parameters for each input data set. The results are saved in separate sessions, which can be called up via the pull-down menu.
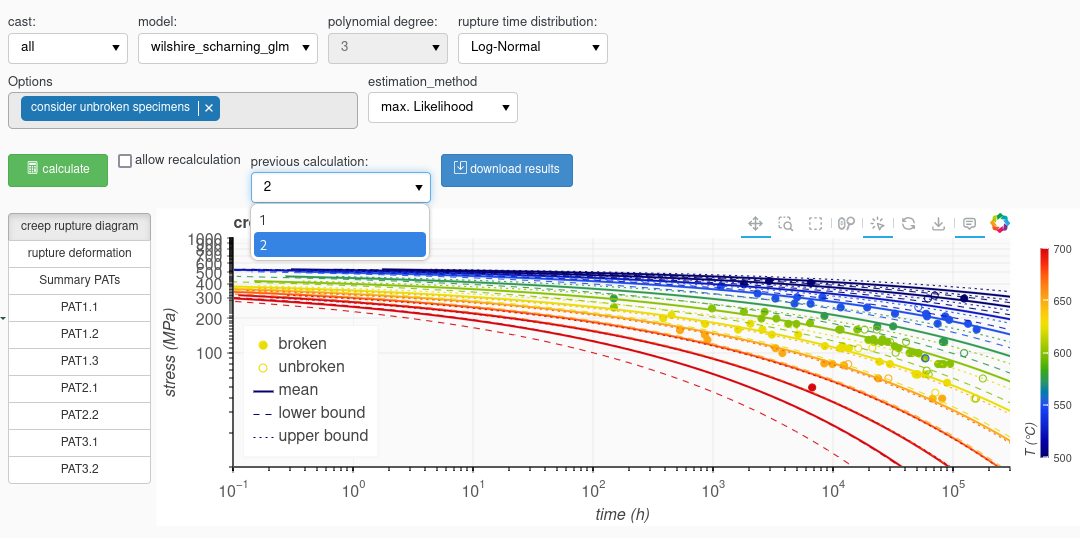
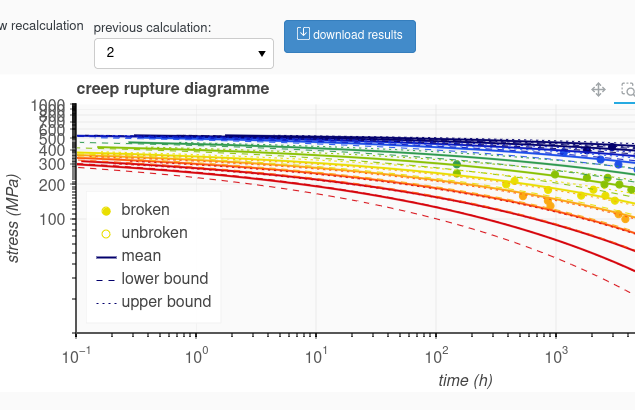
With the plot tool bar above the plots you can zoom, pan, drag etc. through the plot. It’s also possible, to sva the current plot view into a file on your computer.

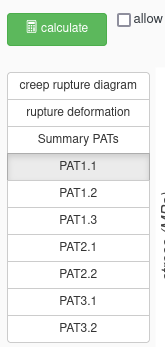
The results of every calculation session can be viewed using the button bar
5.2. Download result file (Excel)
All results of a calculation session can be exported as an Excel file using the “download” button.
The result file contains the following tabs:
“dataset_info”: general infoamtion about the input file
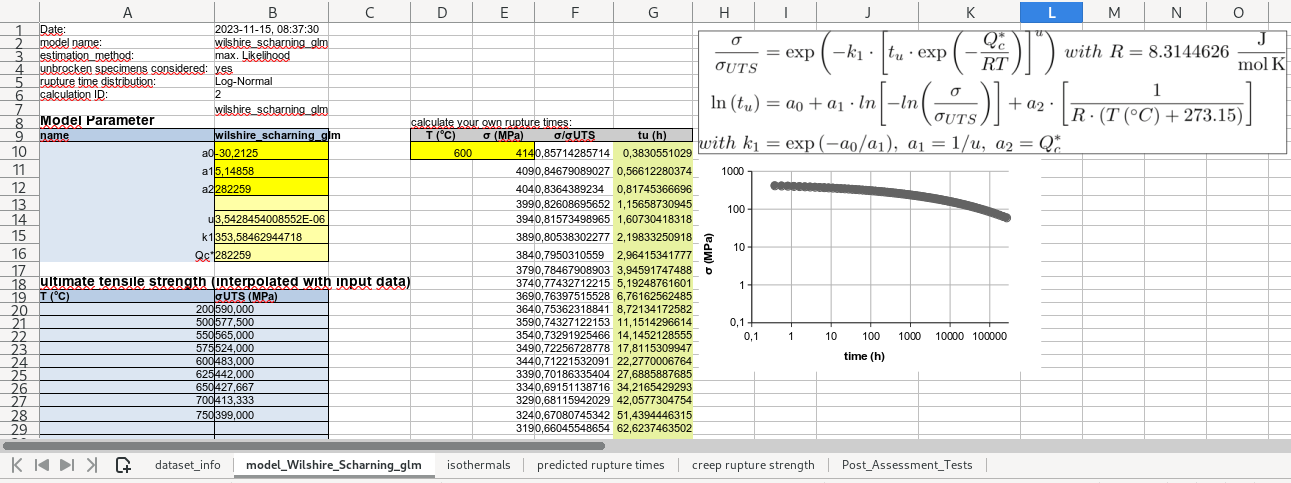
“model_<xxx>”: the model type and the parameters including cells for calculation your own rupture times
“isothermals”: the calculated isothermals for T=T_min to T_max in 25°C steps
“predicted_rupture_times”: all measured input data with the calculated ruptured times
“creep_rupture_strength”: table of predicted creep rupture strength values for the mean values and for the lower boundary
“Post_Assessment_Tests”: result of all individual PATs